Precision
Agronomy
Salinity Mapping · Soil Structure · Spatial Variation · Yield Optimisation
Mapping Soil
Spatial Variability
Electromagnetic (EM) surveys use a non-invasive sensor to measure apparent electrical conductivity (ECa) of the soil at designated depths — without disturbing the ground or requiring laboratory processing.
ECa is primarily influenced by soil salinity, then clay content and moisture. EM data generates spatial layers that reveal soil variability across entire fields, enabling precision management of irrigation, fertiliser and drainage regimes.
EM is the most commonly used instrument in agricultural surveys — delivering high spatial resolution at speeds of up to 20 km/h.
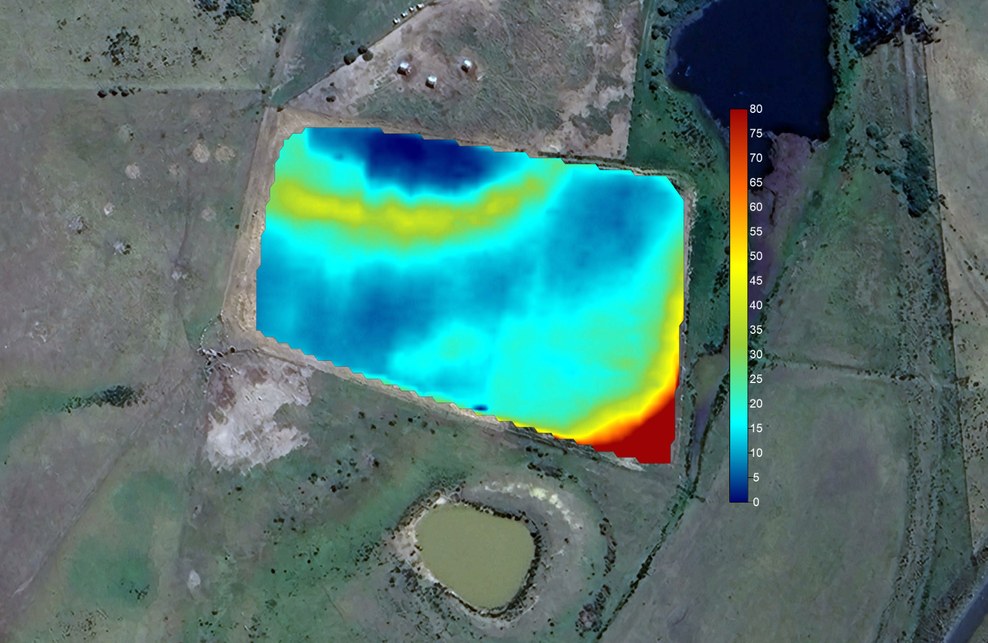
ECa (mS/m) heatmap — warm colours indicate elevated conductivity from saline or clay-rich soils; cooler zones show lower conductivity sandy areas
Uniform-looking paddocks can mask dramatic subsurface variability — ECa mapping reveals what the eye cannot see
Spatial Variation
Drives Yield
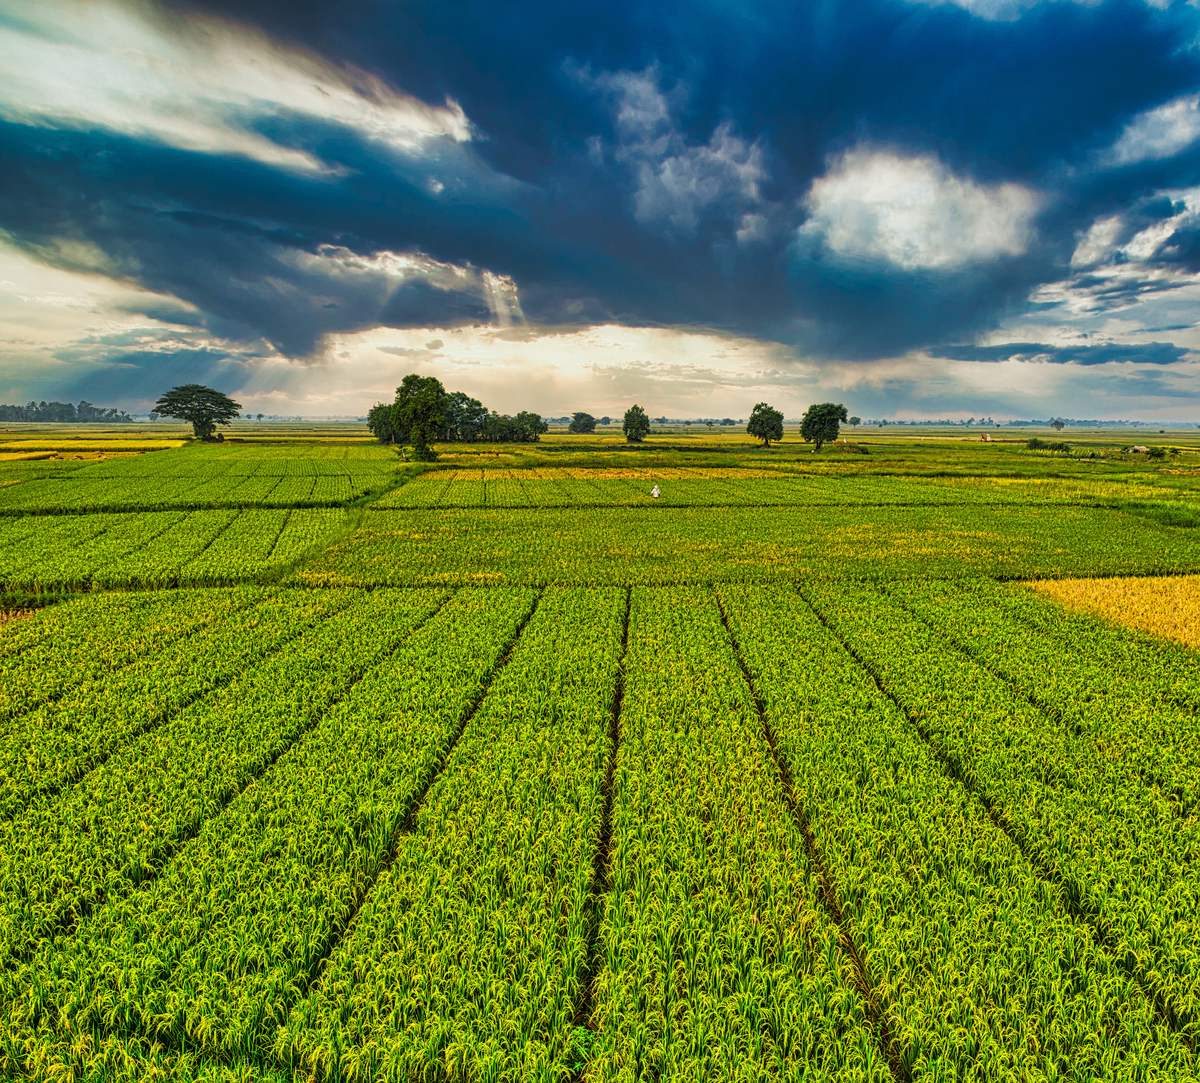
Between 1–4 ML of water per hectare is applied to crops annually depending on soil texture. When adequate structure and drainage is not established, much of that resource is wasted.
Heavy clay soils with fine particles crack and separate within the root zone — water bypasses roots, compacting and waterlogging deeper layers. Spatial soil variation causes uneven plant growth, inefficient water use and ineffective fertiliser application.
Mapping soil variation is crucial for deploying targeted irrigation and fertiliser regimes that minimise cost, optimise yields and support long-term soil sustainability.
- Identify management zones for variable-rate irrigation
- Guide fertiliser placement to high-response areas
- Detect drainage constraints before they limit yield
The Biggest Threat
to Irrigated Crops
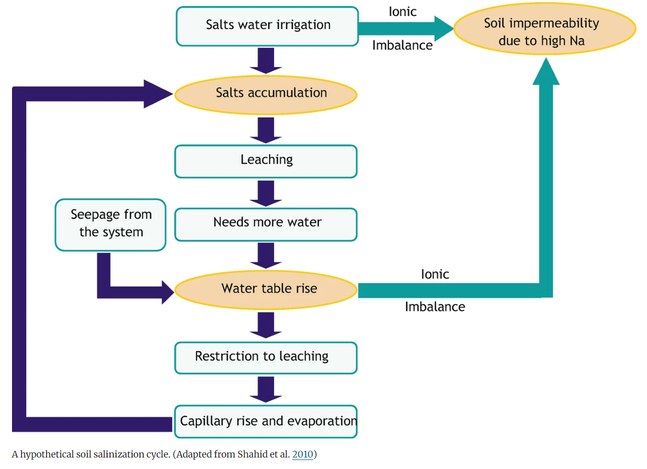
Soil salinity is a major global issue with adverse effects on agricultural productivity and sustainability — and it continues to increase over time. Crop yield variation can exceed 300% with appropriate soil salinity optimisation.
In saline soils the osmotic pressure associated with salt reduces the pressure gradient between soil and root, restricting water flow into the plant — starving it of the water needed for growth and yield.
- Irrigation water — even 'fresh' water adds ~1,088 kg salt/ha/season
- Groundwater & rising water tables
- Weathering of soil minerals and underlying rock
- Ocean-derived salts blown inland
- Fertilisers, gypsum and drip system cleaning agents
High-resolution drone photogrammetry enables centimetre-scale 3D models of vineyard blocks, revealing soil texture variation — sand, clay, clay loam and sandy loam — that drives canopy vigour and berry composition across the block.
Agronomists can delineate management zones with sub-metre accuracy, targeting irrigation, nutrition and canopy management to where it matters most.
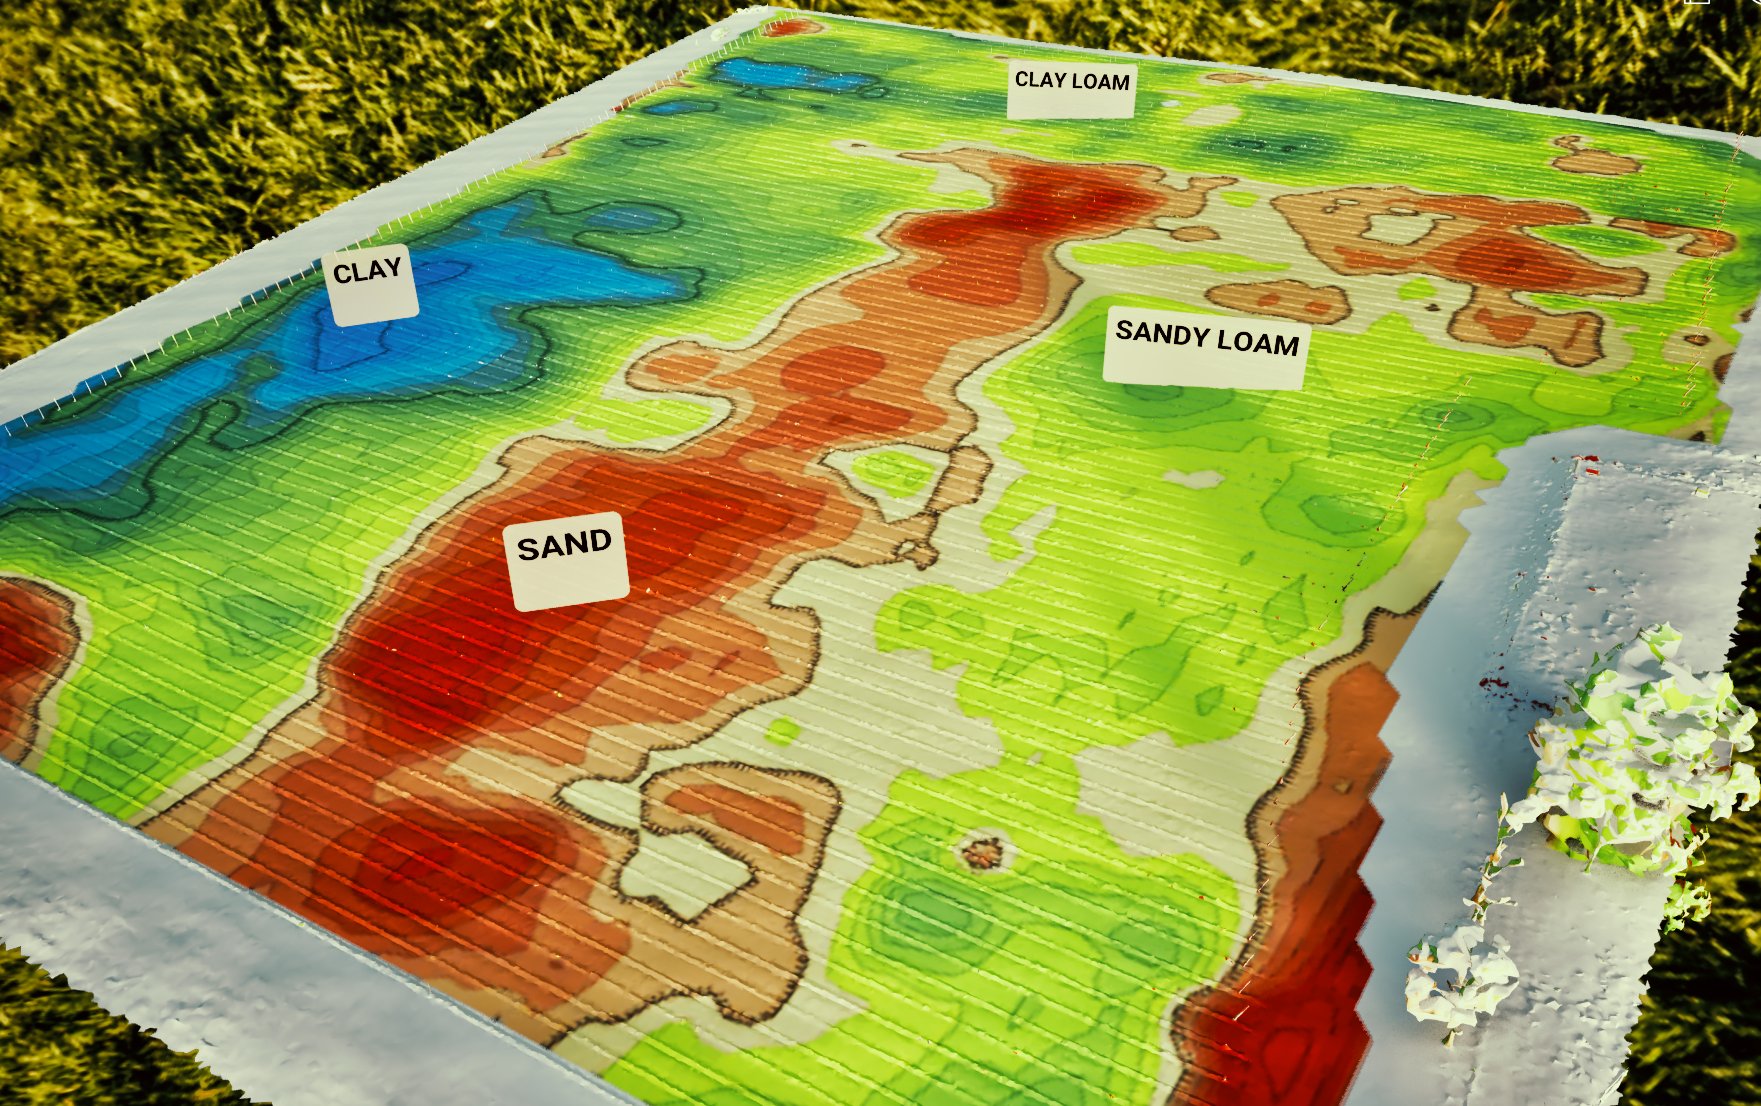
3D photogrammetric soil-texture model of a vineyard block. Red zones indicate sandy soils with low water-holding capacity; blue zones indicate high-clay soils; green zones represent loam transitional areas. Contour lines show relative elevation.
Know Your
Crop Thresholds
Applying 150 mm of clean irrigation water once drainage has been established can reduce salinity levels by 50%. Soluble salts can be leached below the root zone — but only with adequate drainage structure.
| Tolerance | Threshold | Crops |
|---|---|---|
| High | < 600 mS/m | Asparagus, Tall Fescue, Buffalograss, Beets |
| Medium | < 400 mS/m | Tomato, Broccoli, Cauliflower, Cucumber, Pumpkin |
| Low | < 200 mS/m | Beans, Carrot, Onion, Potato, Fruits, Berries |
ECa maps allow growers to overlay crop tolerance thresholds against field variability — identifying at-risk zones before symptoms appear above ground.

What You
Receive
- GPS-integrated ECa at 5 readings/sec
- Swath spacing 1–30 m to requirements
- ~15 ha/hr coverage rate
- Vertical & horizontal dipole modes
- ECa gridding and interpolation
- Depth-resolved forward modelling
- GIS-ready spatial layers
- Multi-depth profile maps
- Salinity risk zones delineated
- Crop tolerance overlay
- Drainage constraint identification
- Variable-rate application targets
- Full interpretation and recommendations
- Yield variation context
- Seasonal monitoring framework
- Integration with existing borehole data
Areas We
Serve in Tasmania
Spaulding Geophysics provides precision agronomy services across Tasmania, from Hobart and Launceston to regional centres, coastal towns, and remote communities statewide.
Spaulding Geophysics delivers on-site precision agronomy services across all of Tasmania — including Hobart, Launceston, Devonport, Burnie, Ulverstone, George Town, Longford, Deloraine, Smithton, Wynyard, Bicheno, St Helens, Scottsdale, Queenstown, Huonville, Kingston, Kettering, Bruny Island and surrounding communities. Remote and regional sites welcomed.